GMAT® Overlapping Sets (Venn Diagrams): A Complete Guide
Venn diagrams might be the friendliest-looking tool in all of test prep. Two circles, a little overlap in the middle, and a picture of the situation appears. You probably drew them in school, and the picture still helps here.
The instinct to draw the circles is a good one. But the drawing itself is only one way to organize the information. The useful step is placing each value in the right region, and you can do that with circles, with a formula, or with a plain table, which can organize the harder versions more cleanly than circles do. This guide covers all three, plus the count-versus-percent trap that catches people who set the problem up correctly and still miss it.
What overlapping sets questions look like
An overlapping sets question sorts one population into two groups at once. A survey where some people like product A, some like product B, and some like both. A language requirement where some employees speak Spanish, some speak Mandarin, and some speak both or neither. Two yes-or-no categories, four possible combinations, and a question about one of them.
These questions come in a count version (65 people, 50 people) and a percent version (40% of respondents), and the type shows up in two places on the GMAT® Focus Edition: as Problem Solving questions in the Quant section, and as Data Sufficiency questions inside Data Insights. The Data Sufficiency versions work a little differently, and we'll get to those below.
The method underneath all of them is the same. The picture is where it starts, because the picture defines the vocabulary.
The four regions and the formula
Two circles sit inside a box that represents the whole population. That gives four regions:
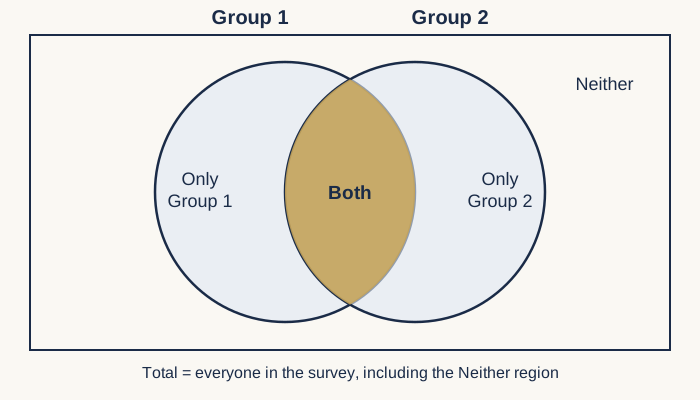
Two of those regions do all the work. The overlap in the middle is the Both region, and the space outside the circles but inside the box is the Neither region. Neither isn't empty just because it sits outside the circles. It's part of the total, and questions ask about it by name.
One formula connects the four regions:
The subtraction is the part to understand rather than memorize. When you add Group 1 and Group 2, each person in the Both region gets counted twice, once per circle. Subtracting Both once removes the duplicate. Neither needs adding at the end because it was never in either circle to begin with.
A quick example with real numbers: in a class of 30 students, 18 take Spanish, 14 take French, and 6 take both. The circles hold students. If 4 students take neither language, the total comes to , and everything checks.
Percent or count: pick one lane
The formula works equally well in counts or in percents, and that flexibility is where the trap lives. A percent version might read: in a survey, 40% of respondents read a morning paper, 30% read an evening paper, and 5% read both. Run the same formula in the same lane, percents end to end, and the neither region comes out to percent of the respondents.
The trap is mixing lanes. If the question gives percents and an answer choice is a count, or the groups have different sizes and the percents describe shares of different wholes, the numbers can't be combined directly. The habit that prevents all of it is writing down what your 100 is before any arithmetic starts. If the problem says 40% of men and 30% of women, the 100 for the men's percent is the men, not the whole population. Confusing those two can cost a question even when the method is familiar.
The table method (and why it beats circles under pressure)
Circles are great for seeing a problem. They're less great for organizing one, because a circle leaves you tracking four regions visually, and a missing value can be easier to overlook. The table version puts every region in its own cell, with totals built in.
The Spanish-and-French class from above becomes this two-way table:
| French | No French | Total | |
|---|---|---|---|
| Spanish | 6 | 12 | 18 |
| No Spanish | 8 | 4 | 12 |
| Total | 14 | 16 | 30 |
Rows are one yes-or-no question, columns are the other, and the four interior cells are the four regions of the Venn diagram. Only-Spanish is the Spanish row meeting the No-French column. Both is where the Spanish row crosses the French column. Neither sits in the corner. The Total row and column do the bookkeeping the circles leave to memory.
Two habits make the table fast. Start with what's given, then use the totals to fill the remaining cells, one subtraction at a time. And build the Total row and column even when the question doesn't ask about them, because those edge values are what let the remaining cells come from one subtraction each. The arithmetic itself rarely goes wrong once the grid is built; the setup was always the part that could go wrong, and the table makes that part visible.
For straight Problem Solving questions, circles and tables both work, so use whichever feels more natural. For Data Sufficiency, the table does something the circles can't: it gives every unknown its own labeled cell. Our guide to Data Sufficiency covers that question type in full.
Overlapping sets in Data Sufficiency
On the Focus Edition, Data Sufficiency lives in the Data Insights section, and overlapping sets statements tend to hand you one cell or total at a time. A statement might give you the number who speak both, or the ratio of only-Spanish to only-French, or the percent of the total who speak neither.
The table turns each statement into a filling-in exercise. Each unknown corresponds to a cell, and each fact usually lands in a cell or a total, so the question of sufficiency becomes a question of whether the grid can complete itself. That can be an easier question to answer while the clock runs than squinting at two circles and wondering what else could be true.
The percent trap gets a Data Sufficiency twist as well. When a statement says 30% of the men or 25% of the employees, check what the percent is of before you combine anything. If the question asks about the whole population but the statements speak in shares of the men and shares of the women, the split between men and women has to come out before those percents can become counts of everyone. Writing "30% of = the men" in the margin takes a moment, and it often prevents the setup error.
How much study time do overlapping sets deserve?
A bounded chunk usually covers it. The formula is one line, which makes it the kind of binary knowledge that belongs on a flashcard: you know it or you don't. Our guide on the types of knowledge that improve your score covers why this kind of topic calls for a different study method than a multi-week skills project.
The grid is the other half, and it's procedural rather than binary. Building it fast, keeping the percents labeled, and connecting each cell back to what the question asks are skills that improve through practice, so they come from drilling a handful of official overlapping sets questions, count and percent versions both, until the setup feels automatic. Our guide on math problems with solutions covers how to study from a worked problem so the method sticks.
Then fold the topic into your question-type audit, the "when I see this type, I do ___" list from our guide to breaking through a score plateau. If you can write "when I see an overlapping sets question, I build the table and label my 100" and that approach keeps working on official questions, you can usually shift your study time to a topic that needs it more.
Try this one
Of the 120 employees at a company, 65 speak Spanish, 50 speak Mandarin, and 15 speak both languages. How many of the employees speak neither language?
(A) 5
(B) 10
(C) 15
(D) 20
(E) 30
Try this one before reading on.
Set the formula up with what's given: the total is 120, the two groups are 65 and 50, and the Both region is 15. Neither is the only unknown.
The answer is (D).
Choice (A) is the trap worth naming: it comes from treating the two groups as if the groups didn't overlap, computing and never touching the overlap information. But the 15 people who speak both were already inside the 65 and inside the 50, so subtracting the two groups pulls those 15 out twice. Adding them back once gives . Choice (C) just restates the Both count the question handed you.
FAQ
What are overlapping sets questions on the GMAT®?
Questions that classify one population into two groups at once, with a possible overlap between the groups. They appear as Problem Solving questions in Quant and as Data Sufficiency questions in the Data Insights section, in both count form (65 people) and percent form (40% of respondents).
What is the formula for overlapping sets?
The Both region gets subtracted because adding the two groups counts it twice, and Neither gets added because it's outside both circles but part of the total. The same formula runs on counts or percents.
Should you use a Venn diagram or a table for overlapping sets?
Either works for Problem Solving, so use whichever feels natural. For Data Sufficiency, the two-way table is usually the safer tool because each unknown occupies one cell and each statement fills cells, which makes sufficiency easier to judge. The circles are best for seeing the setup; the table is best for organizing it.
How do overlapping sets questions appear in Data Sufficiency?
Each statement typically supplies one cell or total of the two-way table, and the question asks whether the table can be completed. Percent statements add a wrinkle: 30% of the men and 25% of the women can't combine into a percent of everyone until you know the split between men and women.
Do overlapping sets questions use counts or percents?
Both versions exist, and some questions switch between them across statements or answer choices. Pick one lane per calculation and stay in it, and write down what your 100 is before combining any percents.
How often do overlapping sets appear on the GMAT®?
The type is a regular in official prep materials and shows up in both the Quantitative and Data Insights sections, though any individual exam may not include one. The efficient approach is a short, well-defined investment: memorize the formula, drill the table until it feels automatic, and move on.
Want to learn even more?
Related reading:
- GMAT® Word Problems: A Complete Guide
- GMAT® Data Sufficiency: How to Approach DS Questions
- GMAT® Data Insights: A Complete Guide
- GMAT® Probability: A Complete Guide
- GMAT® Weighted Averages: A Complete Guide
- Types of Knowledge to Improve Your GMAT® Score: Conceptual vs Procedural
For a worked example of set vocabulary in action, we go through a set-intersection problem in Episode 23 of our Real GMAT® Problems series ("Percent Change, Sets, and Decimals"), including the habit of writing what's given and asked before any math starts. You can search for it on Spotify, Apple Podcasts, or YouTube, where you'll also find our full catalog of strategy episodes.