GMAT® Graphics Interpretation: A Complete Guide
Graphics Interpretation is the Data Insights question type built on a skill you already have: reading charts. You get one graph, a short paragraph of context, and usually two statements with a blank each, which you complete with drop-down menus. After the tabbed documents of Multi-Source Reasoning and the two-column grids of Two-Part Analysis, it can come across as the format with the least new material to learn.
That familiarity is a fair starting point, and it covers less than it seems to. The axis labels carry units the statements depend on, the word suggests narrows what counts as a right answer, and both blanks have to be right for the question to score. This guide covers the format, the reading order that handles those details, and the decisions the scoring rule should shape.
What Graphics Interpretation looks like
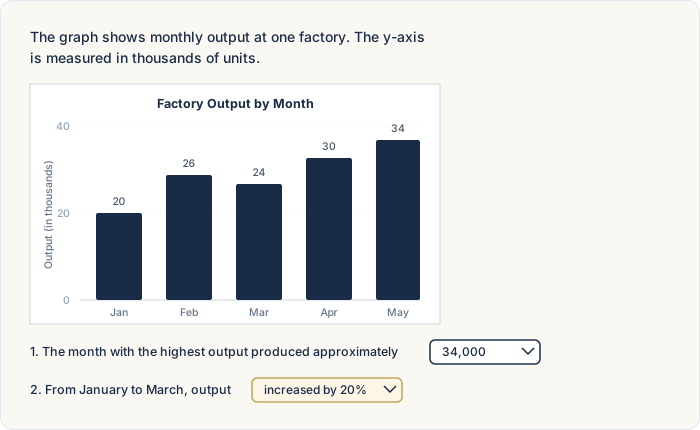
Graphics Interpretation is one of the four integrated reasoning formats inside the Data Insights section, alongside Multi-Source Reasoning, Table Analysis, and Two-Part Analysis, with Data Sufficiency rounding out the section. The screen has three pieces. A chart carries the data: bar charts, line graphs, scatter plots, etc. A short paragraph next to it supplies context and defines anything the chart leaves unclear. Then come the statements, usually two, each with one blank, and each blank gets a drop-down menu.
The drop-downs usually offer between three and five answer choices, and the options are built to catch specific misreadings: the value that's missing a zero, the units in the wrong scale, the claim that goes beyond what the chart supports. Picking the correct option in one blank and the wrong one in the other earns nothing, the same all-or-nothing rule that applies to the section's other multi-part formats.
One note for anyone practicing from older materials: questions from the GMAT® Classic era sometimes show three statements instead of two, and some use a single statement with two blanks in it. The workload shifts a little, and the approach doesn't.
Read the title and the axes first
The reading order is title and axes first, statements second.
Chart-reading habits from school usually work in the other order: readers focus on the plotted values and skim the labels. These questions build the statements from the labels. A statement about the third quarter points at the x-axis, a statement about the size of a change points at the y-axis scale, and a statement about what a trend implies points at the wording in the title. When you read the labels first, the statements can be checked against the chart in one reading instead of two.
The scale note deserves its own line on the scratch pad. Some charts print one beside an axis: numbers that read 1, 2, 3, 4, 5 with a note that the axis is in hundreds of millions. A data point at 6 means 600 million there, and the answer choices will usually include 6 million and 60 million, built to catch the reader who reads the axis numbers without the note. That slip is remarkably easy to make late in the exam, when you're tired and moving quickly, and it's one of the worst reasons to lose a question on an exam this important. As soon as you read the scale, write down what one axis unit is worth, something like "x-axis: hundreds of millions." One line of scratch-pad work can prevent it.
Answer only what can be proven
Two reading habits handle the statements.
The first: interpret the chart as simply as you possibly can. If a statement has a complicated reading and a simple one, the simple one is probably what the question intends. Charts on this exam can look busy, and a reader under time pressure sometimes works out a more elaborate interpretation than the data supports. Try the plainest one first: the highest bar, the steepest segment, the closest point.
The second: treat suggest and support as provable-from-the-chart words. When a statement says the graph suggests something, the question isn't asking what you believe the chart means; it's asking what can be proven from what's printed on it. A line can show that one value rose while another fell, but it can't show why. Statements about causes, intentions, or future events go beyond what a chart can prove, even when they sound plausible. Our guide to Multi-Source Reasoning covers this vocabulary rule in depth, and it applies across the whole Data Insights section.
No partial credit, and what it changes
Both blanks have to be right. One right and one wrong scores as a wrong question, the same all-or-nothing rule that applies to Multi-Source Reasoning, Table Analysis, and Two-Part Analysis.
The rule matters most when a question is half-answered. If you're confident about one blank and lost on the other, the blank you can't answer decides the whole question. And when a chart stays confusing (some of them, like bubble charts, take a second read to parse), picking an answer and moving on costs less than staying. The sequence we recommend: read the title and the axes, then ask whether you have a reasonable shot at answering. If the answer is no, pick, flag, and go. The review feature lets you change answers on up to three questions per section, so an early guess isn't a final decision. Our guides to guessing on Data Insights and when to let go of a question cover the broader judgment.
Timing and the calculator
The Data Insights section runs 20 questions in 45 minutes, which works out to about two minutes and 15 seconds per question. Graphics Interpretation questions can be time-intensive, and the reading order is part of the reason: a careful pass over the title, axes, and units up front costs a moment, and it prevents the expensive kind of miss, where the work is right and the units are wrong. If you're deep into a chart you can't parse, use the reasonable-shot check from the last section. Our guide to timing strategy covers pacing for the whole section.
The on-screen calculator is available throughout the Data Insights section, Graphics Interpretation included. Most of these questions run on reading rather than computation, so the tool usually stays closed. Our guide to the calculator rules covers what it can and can't do.
How to study for Graphics Interpretation
Three things, in order.
Quant and verbal first. The format is new, and the material underneath is quant and verbal you're already studying. The prep you're already doing is the prep these questions draw on.
Then format practice at volume. The read-the-axes-first habit is a reflex, and reflexes come from repetitions. Older integrated reasoning material from the GMAT® Classic era should work fine for this, because the chart types and the drop-down structure carried into the Focus Edition close to unchanged, three-statement versions and all. Our guide to the Data Insights section covers the section's other formats.
Then the audit. Add the type to the question-type audit from our guide to breaking through a score plateau: "when I see a chart, I read the title and axes, write down what one axis unit is worth, and answer only what the chart can prove."
Try this one
Practice question — Graphics Interpretation
The graph shows the number of employees at one company who worked remotely, by year. On the exam, each blank below is a drop-down menu. Choose an option for each blank.
1. In 2024, the number of remote employees was closest to .
2. From 2021 to 2024, the number of remote employees .
Reveal answers
Blank 1: 2,200. The note on the y-axis says the values are in thousands, so the 2024 point at 2.2 means $2.2 \times 1{,}000 = 2{,}200$ employees. The choices 220 and 22,000 catch the unit slip.
Blank 2: decreased overall. The line falls from 3.6 in 2021 to 2.2 in 2024, but not every year: it rises from 3.1 in 2022 to 3.3 in 2023. "Decreased every year" fails on that one segment.
Try this one before reading on. Read the title, the axes, and the units note first; then fill both blanks.
The first blank is a units check. The note beside the y-axis says the values are in thousands, and the 2024 point sits at 2.2 on that scale, so the count is employees. Answer choices that drop or add a zero appear on these questions for this reason, and the note on the axis is what tells them apart.
The second blank is a read-the-whole-line check. From 2021 to 2024 the count ends lower than it started, which supports "decreased overall," but the line rises from 2022 to 2023, so "decreased every year" fails. A statement about every year needs every segment checked.
Both blanks had to be right for the question to score. One units note and one careful pass over the segments did all the work, and that's how most Graphics Interpretation questions are built.
FAQ
What is Graphics Interpretation on the GMAT®?
A Data Insights question type that shows one chart, a short paragraph of context, and usually two statements with one blank each. You complete each blank with a drop-down menu, and the content draws on the same quant and verbal material as the rest of the section.
How many drop-downs does a Graphics Interpretation question have?
Usually two, one per statement, with three to five options in each. Questions from the GMAT® Classic era sometimes show three blanks. Every blank has to be answered correctly for the question to score.
Do you get partial credit on Graphics Interpretation?
No. One wrong blank scores the whole question as wrong. It's the same all-or-nothing rule the section's other multi-part formats follow.
Can you use the calculator on Graphics Interpretation?
Yes. The on-screen calculator is available throughout the Data Insights section. Most of the work on these questions is reading, so the tool usually sits idle.
What does "suggests" mean on Graphics Interpretation questions?
On this exam, suggest means provable from the chart. The question is asking what the printed data supports, not what you believe the chart means, and statements about causes or future events usually go beyond what a chart can prove.
What's the difference between Graphics Interpretation and Table Analysis?
Graphics Interpretation gives one chart with fill-in-the-blank statements; Table Analysis gives a sortable table with three Yes-or-No statements. Both score all-or-nothing, and both draw on the same quant and verbal content.
How do you solve Graphics Interpretation questions?
Read the title and the axes first, write down what one axis unit is worth, then read the statements and answer only what the chart can prove. If a chart isn't making sense, pick an answer, flag the question, and move on.
Want to learn even more?
Related reading:
- GMAT® Data Insights: A Complete Guide
- GMAT® Multi-Source Reasoning: A Complete Guide
- GMAT® Two-Part Analysis: A Complete Guide
- GMAT® Table Analysis: A Complete Guide
- How to Guess on GMAT® Data Insights: Elimination Tactics for Every DI Question Type
- GMAT® Timing Strategy: How to Pace Each Section
Our podcast episode "GMAT® Focus Data Insights: The Complete Guide for 2024 and Beyond" walks through the whole Data Insights section, Graphics Interpretation included, and "What Everyone Should Know About the Integrated Reasoning Section" covers where these questions come from. You can listen on Spotify, Apple Podcasts, or YouTube, where you'll find our full catalog of strategy episodes.